


First, let us settle a long-standing semantic dispute. A few weeks ago, the Highways and Surface Transport Minister Nitin Gadkari stated that he has vowed to Prime Minister Narendra Modi that the country’s logistics costs would come down from above 14 per cent to single-digits by 2026. A few days ago, Piyush Goyal, who handles the commerce and industry portfolio indirectly indicated that the logistics costs in India were already in single-digits, at eight per cent.
Why indirectly? Within Goyal’s ministry, there is a Department for Promotion of Industry and Internal Trade that sponsored a detailed research study of logistics costs, which was conducted by the think tank, National Council of Applied Economic Research. The conclusions showed that the logistics costs were 7.9 per cent of the GDP, and just over nine per cent of non-services (related only to the relevant agriculture, mining, and manufacturing) output.
So, who is correct? Gadkari or Goyal? As stated earlier, this is just a matter of semantics. There are two ways of looking at logistics costs. At a macro level, one can look at it as a percentage of GDP or gross value-added. At the micro level, it can be seen as a percentage of the final prices of products. One measures competitiveness at a national level. The other does the same at a sectoral level. NCAER’s calculations are at the national level, and it estimates the total logistics costs at `24 lakh crore for the entire nation.
If we believe NCAER, India is more competitive than South Korea (eight per cent), and China (14 per cent) is 75 per cent expensive. The India figure in this case is lower than the earlier (2016) estimates of 13 per cent. More importantly, within the past three years, the figure, as per NCAER estimates, has come down from over 9.6 per cent of GDP to below eight per cent. There seems to be a disconnect. Something is off, something does not gel with subjective experiences.
Let us look at the scenario from another angle, which is revealed in the NCAER study. In 2018, the think tank adopted a “hybrid approach,” and estimated the cost to be 8.1 per cent (for 2017-18). Later, in 2023, it did a “quick assessment study and derived tentative estimates of logistics cost” to arrive at a range of 7.8-8.9 per cent of GDP (for 2021-22). Given this background, the cost structure in the country has not changed much over the past seven years. Although, as the present study indicates, the percentage may have gone up drastically after the pandemic, and came down again.
As the latest study admits, capturing the logistics costs either as a percentage of GDP or non-services output may suffer from inherent oddities and inaccuracies. “Furthermore… (it) does not capture region-wide variations…. For a large and diverse country like India, with varying levels of development across states, it is important to understand the zone-wise or region-wise differences in logistics costs for effective policy intervention,” states the study. There is a difference between developed and developing nations. In the case of the former, with higher GDP, and higher share of the sector services, it translates into lower logistics costs as a percentage of GDP.
In India, surprisingly, the opposite trend is true. Despite being dubbed as an emerging market, the services sector, which does not incur any logistics costs, accounts for nearly 65 per cent of the GDP. Thus, the growth of logistics costs will invariably be lower than the GDP growth, if it is driven by the services sector. But NCAER states that the compounded annual growth rate (CAGR) in non-services output, i.e., minus services, between 2018 and 2024 was 0.5 per cent higher than the figure for the overall logistics costs. The difference is starker, about three per cent, for the respective figures between 2021-22 and 2023-24. These indicate logistics costs are growing slower than the growth rates in agriculture and manufacturing.
One cannot underestimate the differences between sectors, and between products within them. The NCAER study estimates that logistics costs as percentage of output is a higher 8.57 per cent for aluminium, and 9.57 per cent for food items. For textiles and apparel, it is significantly higher at almost 15 per cent. This, perhaps, explains why Indian textiles exports are not globally competitive.
“Some commodities like coal are predominantly transported by railways, while electronics and pharma commodities are mostly transported by air. There are also variations between containerised and non-containerised goods, temperature-sensitive and non-temperature-sensitive commodities, dangerous goods, etc. This results in significant variation in logistics costs across sectors and commodities. Measuring logistics cost as a percentage of GDP cannot capture these variations,” admits the NCAER study.
For example, transportation costs vary wildly. The NCAER study estimates that the cost per tonne per km for cargo movement through the rail network is `1.96. For roadways, it is nearer to two times, at `3.78. Within the road segment, the cost for low-axle light trucks is a huge `11, and `1.5, or less than half of the overall figure, for heavy-duty trailers. Fuel comprises more than 40 per cent of road-related costs. While the average cost for waterways is ` 2.3, there is a variation between coastal shipping (`1.8), and inland water (`3.3). The cost is a whopping `72 for air cargo.
There are massive differences among the firms. For a small firm with an annual revenue of up to `5 crore, the cost as percentage of the output works out to almost 17 per cent, or more than double the national average of eight per cent. For a firm with a revenue that is more than `250 crore, the figure is 7.6 per cent. This is nothing but the principle of economies of scale at work in real life. Obviously, “the larger firms (are) better positioned to leverage integrated supply chains, and higher levels of process efficiency,” states the report.
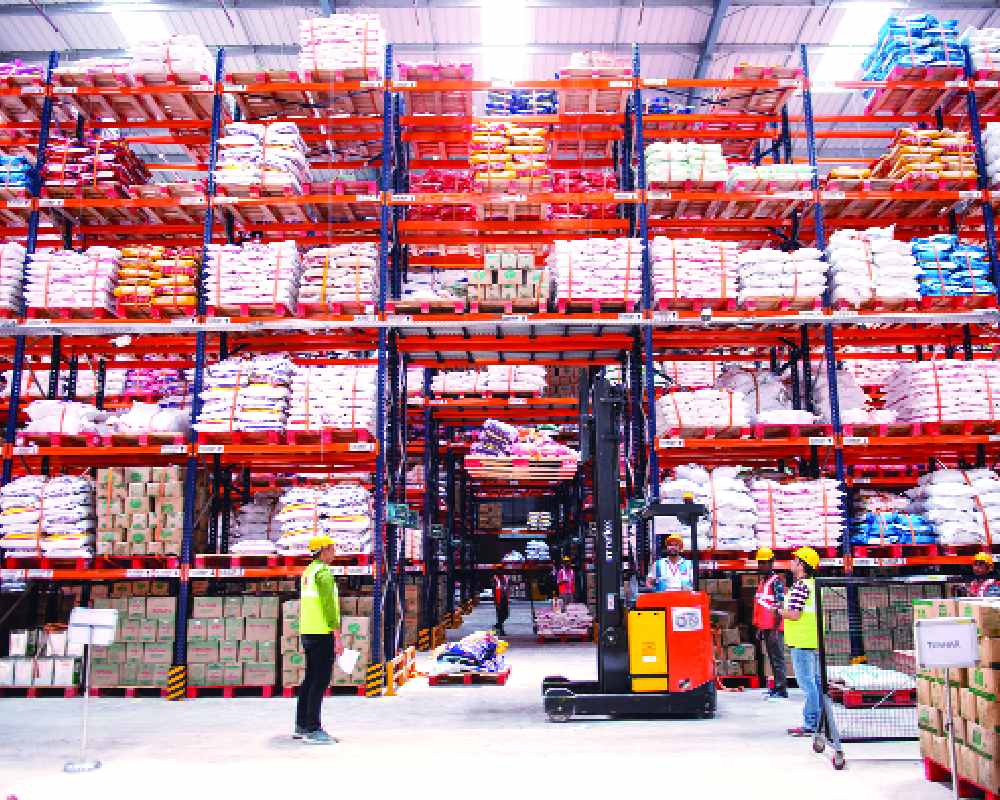
One can contest the lower NCAER figures, or judge the higher one by Gadkari, but there can be no denying that there has been a significant improvement in quality and efficiency of logistics operations. One reason has been the massive investments in road, rail, air, and port infrastructure. This has considerably reduced the time taken for products to reach their destinations from the factory gate. While a lot still needs to be done in terms of warehousing, the situation has improved. Quantitative data is good.
On expressways, the average speed of trucks has crossed 50 km per hour, even as it languishes at 25 km on state highways. The average speed of freight trains has more than doubled from about 20 km per hour to close to 50 km. The turnaround time in ports has fallen from four days to one day. To cap it all, Gati Shakti has boosted multimodal transport and logistics. But maybe, it is time to gauge quality and efficiency. The costs do not capture the costs of delays, maintenance, and capital costs to buy a fleet, or own warehouses.
The author has worked for leading media houses, authored two books, and is now Executive Director, C Voter Foundation