


Welthungerhilfe’s Index cannot be considered an academic exercise for sure, at best a political stunt to show certain developing countries in bad light
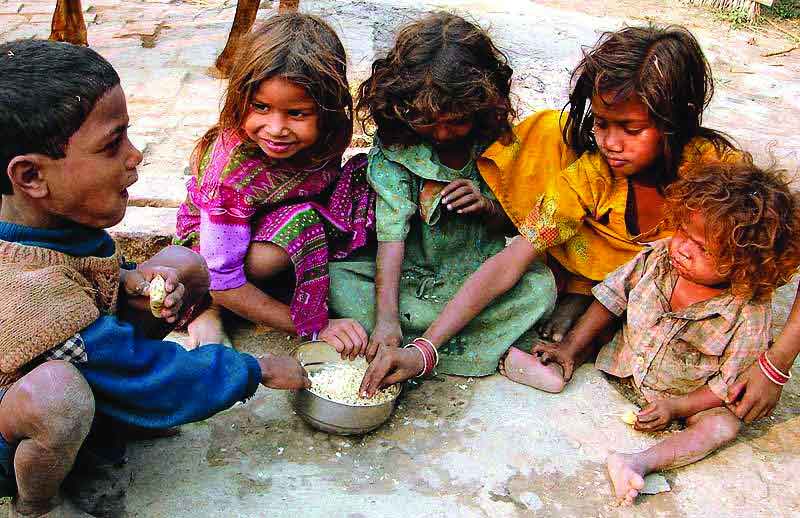
Recently Germany-based Welthungerhilfe ranked India at slot 101 among their hunger list of 116 countries. The report has put serious aspersions on India's efforts to provide nutrition food to its citizens, with only 15 countries behind it. Welthungerhlife's Hunger Index in India has declined from 38.8 in the year 2000 to 27.5 in 2021, indicating that hunger has come down in the last two decades. The poor ranking in hunger gives critics of the PM Narendra Modi government ammunition to criticise the regime for incidence of hunger has increased during the coronavirus pandemic.
The research report has problems that need to be dealt with. The details of report, data, analysis and even methodology appears faulty. It cannot be used to determine the trajectory of domestic policy-making and feedback of ground realities. It cannot be considered as an academic exercise for sure, at best an extended political stunt to show certain developing countries and their regimes in a bad light. That too is done shabbily. India certainly needs to appropriately assess its nutrition problem, it must be dealt with all seriousness. However, Welthungerhilfe's report deserves to be binned.
Hope India's mission in Germany has already sent their rebuttal to this report, if not, then it must me sent in harshest words and that too quickly. Let us understand the methodology and data used in this index; and how they affect the index. First, the results published on India in Global Hunger Index do not exactly match the production figures of these commodities by the Ministry of Agriculture, Government of India. The production of food grains and other food items like milk, eggs, vegetables, fruits, fish, etc. has been increasing in India. If we look at the last two decades, the total production of milk was only 777 lakh tonnes in the year 2000, which increased to 2000 lakh tonnes by 2020 and our daily per capita milk production has reached 394 grams. The total production of eggs was 11440 crores per year in 2019-20, as compared to only 3050 crores in the year 2000. That is, now the per capita availability of eggs has reached 86. Along with this, the availability of vegetables, fruits, meat, pulses and edible oils and other food items has all increased at an unprecedented rate. Surprisingly, the per capita availability of these food items is far less in the countries, which are shown above India.
More problems; to prepare the Hunger Index, they have to use National Sample Survey Organisation's (NSSO's) food consumption data as per the notified methodology; but interestingly, no survey of NSSO has been published after the year 2011-12. It may be mentioned that the publication of the 2015-16 Round of NSSO in this regard was withdrawn by the government due to serious deficiencies therein. So,if the Hunger Index for 2021 has been prepared using the same data from 2011-12, it would be ridiculous.
A thorough analysis of the data is essential before we make any commentary or design government policy.
Major problem areas; Welthungerhilfe's Global Hunger Index, does not collect any data itself, on consumption of food items, but only makes use of data compiled by the World Food Organization (FAO). In the past, the FAO has been dependent on the National Nutrition Monitoring Board (NNMB), a premiere Indian organisation, regarding data on food consumption. The NNMB states that the FAO and Welthungerhilfe in their methodology estimate the consumption of food on the basis of per capita consumer spending published by the NSSO. But NNMB says that they did not conduct any survey of food consumption in rural areas after 2011 and in urban areas after 2016. Welthungerhilfe also appears not to have used data from the Board but a Gallop Survey by a private organization without any justification.
More holes in the survey; do these indicators used in the Global Hunger Index really measure hunger? If these indicators are the result of hunger, then rich people who have no problem with access to food, why should their children be stunted and wasted. The 2016 data from the National Institute of Nutrition (NIN) for 16 states shows that even among the rich (owning cars, homes), 17.6 per cent and 13.6 per cent children, respectively, suffer from stunting and wasting. And, mothers with overweight and obesity (with adequate access to food) were more likely to have children with signs of stunting (22 per cent) and wasting (11.8 per cent).
Earlier, no questions were raised on the methodology or data used in preparing the Hunger Index. But due to the low ranking of India in terms of hunger and errors in the data used in this regard, the methodology and data used in preparing this index has come under scrutiny.
The report says the mortality rate has decreased in children under the age of 5 years, and incidence of stunting in children under the age of 5 years has also decreased. But a paradox in this report is that recently during the pandemic, the proportion of population with evidence of malnutrition has increased; so also the proportion the wasted children under the age of five years.
This report is published every year. Although this report compares hunger in different years, the report acknowledges that the index, ranking and indicators given in this report are limited to this year only. That is, a comparison cannot be made between different years in this regard, as there is a difference in the sources of data and methodology in different years.
The organization has prepared the formula of hunger index in such a way, where there are three equal parts - one third part is food availability, the other third is the mortality rate of children under 5 years and the remaining third is malnutrition among children. There are two indicators of malnutrition in children under the age of five - wasting and stunting. That is, a total of 4 indicators and 3 dimensions are used in the hunger index.
Periodic surveys are conducted by the National Family Health Survey (NFHS) regarding malnutrition among children and those figures can be considered reliable. Similarly, data on mortality rate in children is collected on actual basis, even that does not indicate any problem. It is noteworthy that the proportion of children stunted below 5 years of age has declined from 54.2 percent between 1998-2002 to 34.7 percent between 2016-2020. That is, now children are getting taller than before. Experts believe that since babies are getting taller than before, they are getting thinner (so-called wasted) due to their increasing height, which is a good sign. In such a situation, there is a flaw in the methodology of measuring hunger, by simultaneously using data on wasting, with declining incidence of stunting.
The time has come to call out such motivated surveys. And developing countries must come out together to bring out reports giving a better picture of ground realities, not a mere jugglery with numbers.